
NORTHERN VIRGINIA · OCTOBER 2026 MARKET REPORT
Fewer new contracts. Prices moving in different directions. Chris Colgan’s latest livestream puts nine local housing markets side by side.
Northern Virginia’s housing slowdown is showing up most clearly in the flow of new contracts. In the September SmartCharts reports Chris Colgan presented during his October 22 livestream, new pending sales declined from a year earlier in eight of the nine markets he reviewed. Stafford County was the exception.
Prices told a less uniform story. Fairfax County’s median sold price rose 5.6% year over year. Loudoun’s edged up 0.8%. Alexandria City’s fell 11.4%. Those differences are the reason to look beyond one regional headline—and beyond a countywide median when deciding what to do with a particular home.
The main takeaway: Chris sees a slower, more demanding market for sellers and opportunities for selective buyers. The September figures support an uneven picture: softer contract activity in most of the areas covered, with prices and negotiating conditions varying by location and property type.
September’s market, side by side
These figures come from the September 2026 SmartCharts / Bright MLS Local Market Insight reports displayed in Chris’s livestream. The table uses all property types for each named jurisdiction. All percentage comparisons in this table are against September 2025, not the previous month.
| Market | Closed sales | Median sold price | Price vs. Sept. 2025 | New contracts vs. Sept. 2025 |
|---|---|---|---|---|
| Fairfax County | 897 | $749,750 | +5.6% | −18.7% |
| Alexandria City | 143 | $660,000 | −11.4% | −10.9% |
| Arlington County | 175 | $655,000 | −4.6% | −6.8% |
| Prince William County | 389 | $579,990 | −3.7% | −17.1% |
| Fauquier County | 76 | $631,495 | +4.8% | −20.7% |
| Loudoun County | 338 | $758,500 | +0.8% | −26.0% |
| Frederick County, VA | 126 | $420,000 | −6.7% | −6.8% |
| Stafford County | 135 | $515,000 | −0.8% | +6.3% |
| Culpeper County | 44 | $475,500 | −4.1% | −31.6% |
Source: SmartCharts / Bright MLS reports presented by Chris on October 22; transcribed from the visible report pages and reviewed October 23. “New contracts” refers to the reports’ New Pendings metric. Closed-sale counts show the monthly sample behind each median. County boundaries do not include independent cities: Fairfax County is separate from Fairfax City; Prince William excludes Manassas and Manassas Park; Frederick County, Virginia, excludes Winchester. Alexandria means Alexandria City, not every property with an Alexandria mailing address.
New contracts and closed sales answer different questions. Contracts show buyers making commitments during the month. Closings record transactions reaching the finish line, often after negotiations in an earlier month. Neither should be substituted for the other.
A median is the middle sale price among the homes that closed. It can change when the mix of homes changes. Alexandria’s 11.4% decline, for example, is not evidence that every Alexandria owner lost 11.4% of their home’s value.
Keep the local numbers in perspective.
Follow Northern Virginia housing, development and community news with Real NoVA Network.
Get the Real NoVA newsletter →What stands out in each market
Fairfax County: higher prices, fewer new commitments
Fairfax’s September median reached $749,750, up 5.6%, across 897 closed sales. New pendings fell 18.7% to 846. The report also showed 2,326 active listings at month-end and 26 average days on market.
That combination matters to sellers: a higher median does not eliminate competition for buyers. Chris moves into the property-type pages during the Fairfax discussion because a detached house, townhouse and condo can face different alternatives even within the same county. Watch the Fairfax discussion from 3:22.
Alexandria City and Arlington: the monthly median needs context
Alexandria recorded 143 closings and a $660,000 median. New pendings declined 10.9% to 147. Its January–September median, however, was $720,000—unchanged from the comparable 2025 period. The latest month and the longer view are telling different parts of the story.
Arlington’s September median was $655,000, down 4.6%, with 175 closings. New pendings fell 6.8% to 178. Yet its year-to-date median was $800,000, up 6.8%. This is precisely why a seller should compare the actual home with similar properties rather than apply a countywide percentage mechanically. Alexandria begins at 6:14; Arlington at 8:03.
Prince William County: a softer month inside a stronger year-to-date total
Prince William closed 389 sales in September at a median of $579,990, down 3.7% year over year. New pendings fell 17.1% to 372. Across January through September, though, the county recorded 4,081 closings, compared with 3,764 in the same 2025 period; its YTD median was $599,000.
Chris’s discussion of builders and stacked condos adds a practical point: buyers are choosing between different versions of a home they can afford. His conversations with builders are firsthand observations, not a separate statistical sample. The condo category in a market report also covers more than stacked condos, so it should not be read as a report about one builder or floor plan. Watch Prince William from 9:37, including the condo discussion around 12:03.
Fauquier County: price growth does not erase the contract slowdown
Fauquier’s median was $631,495, up 4.8%, across 76 closings. New pendings fell 20.7% to 69. A seller can see a positive price number and still need to work harder for the next offer. With fewer monthly sales than the larger counties, changes in the mix of homes also deserve attention. Watch Fauquier at 13:03.
Loudoun County: the price headline is steadier than the activity
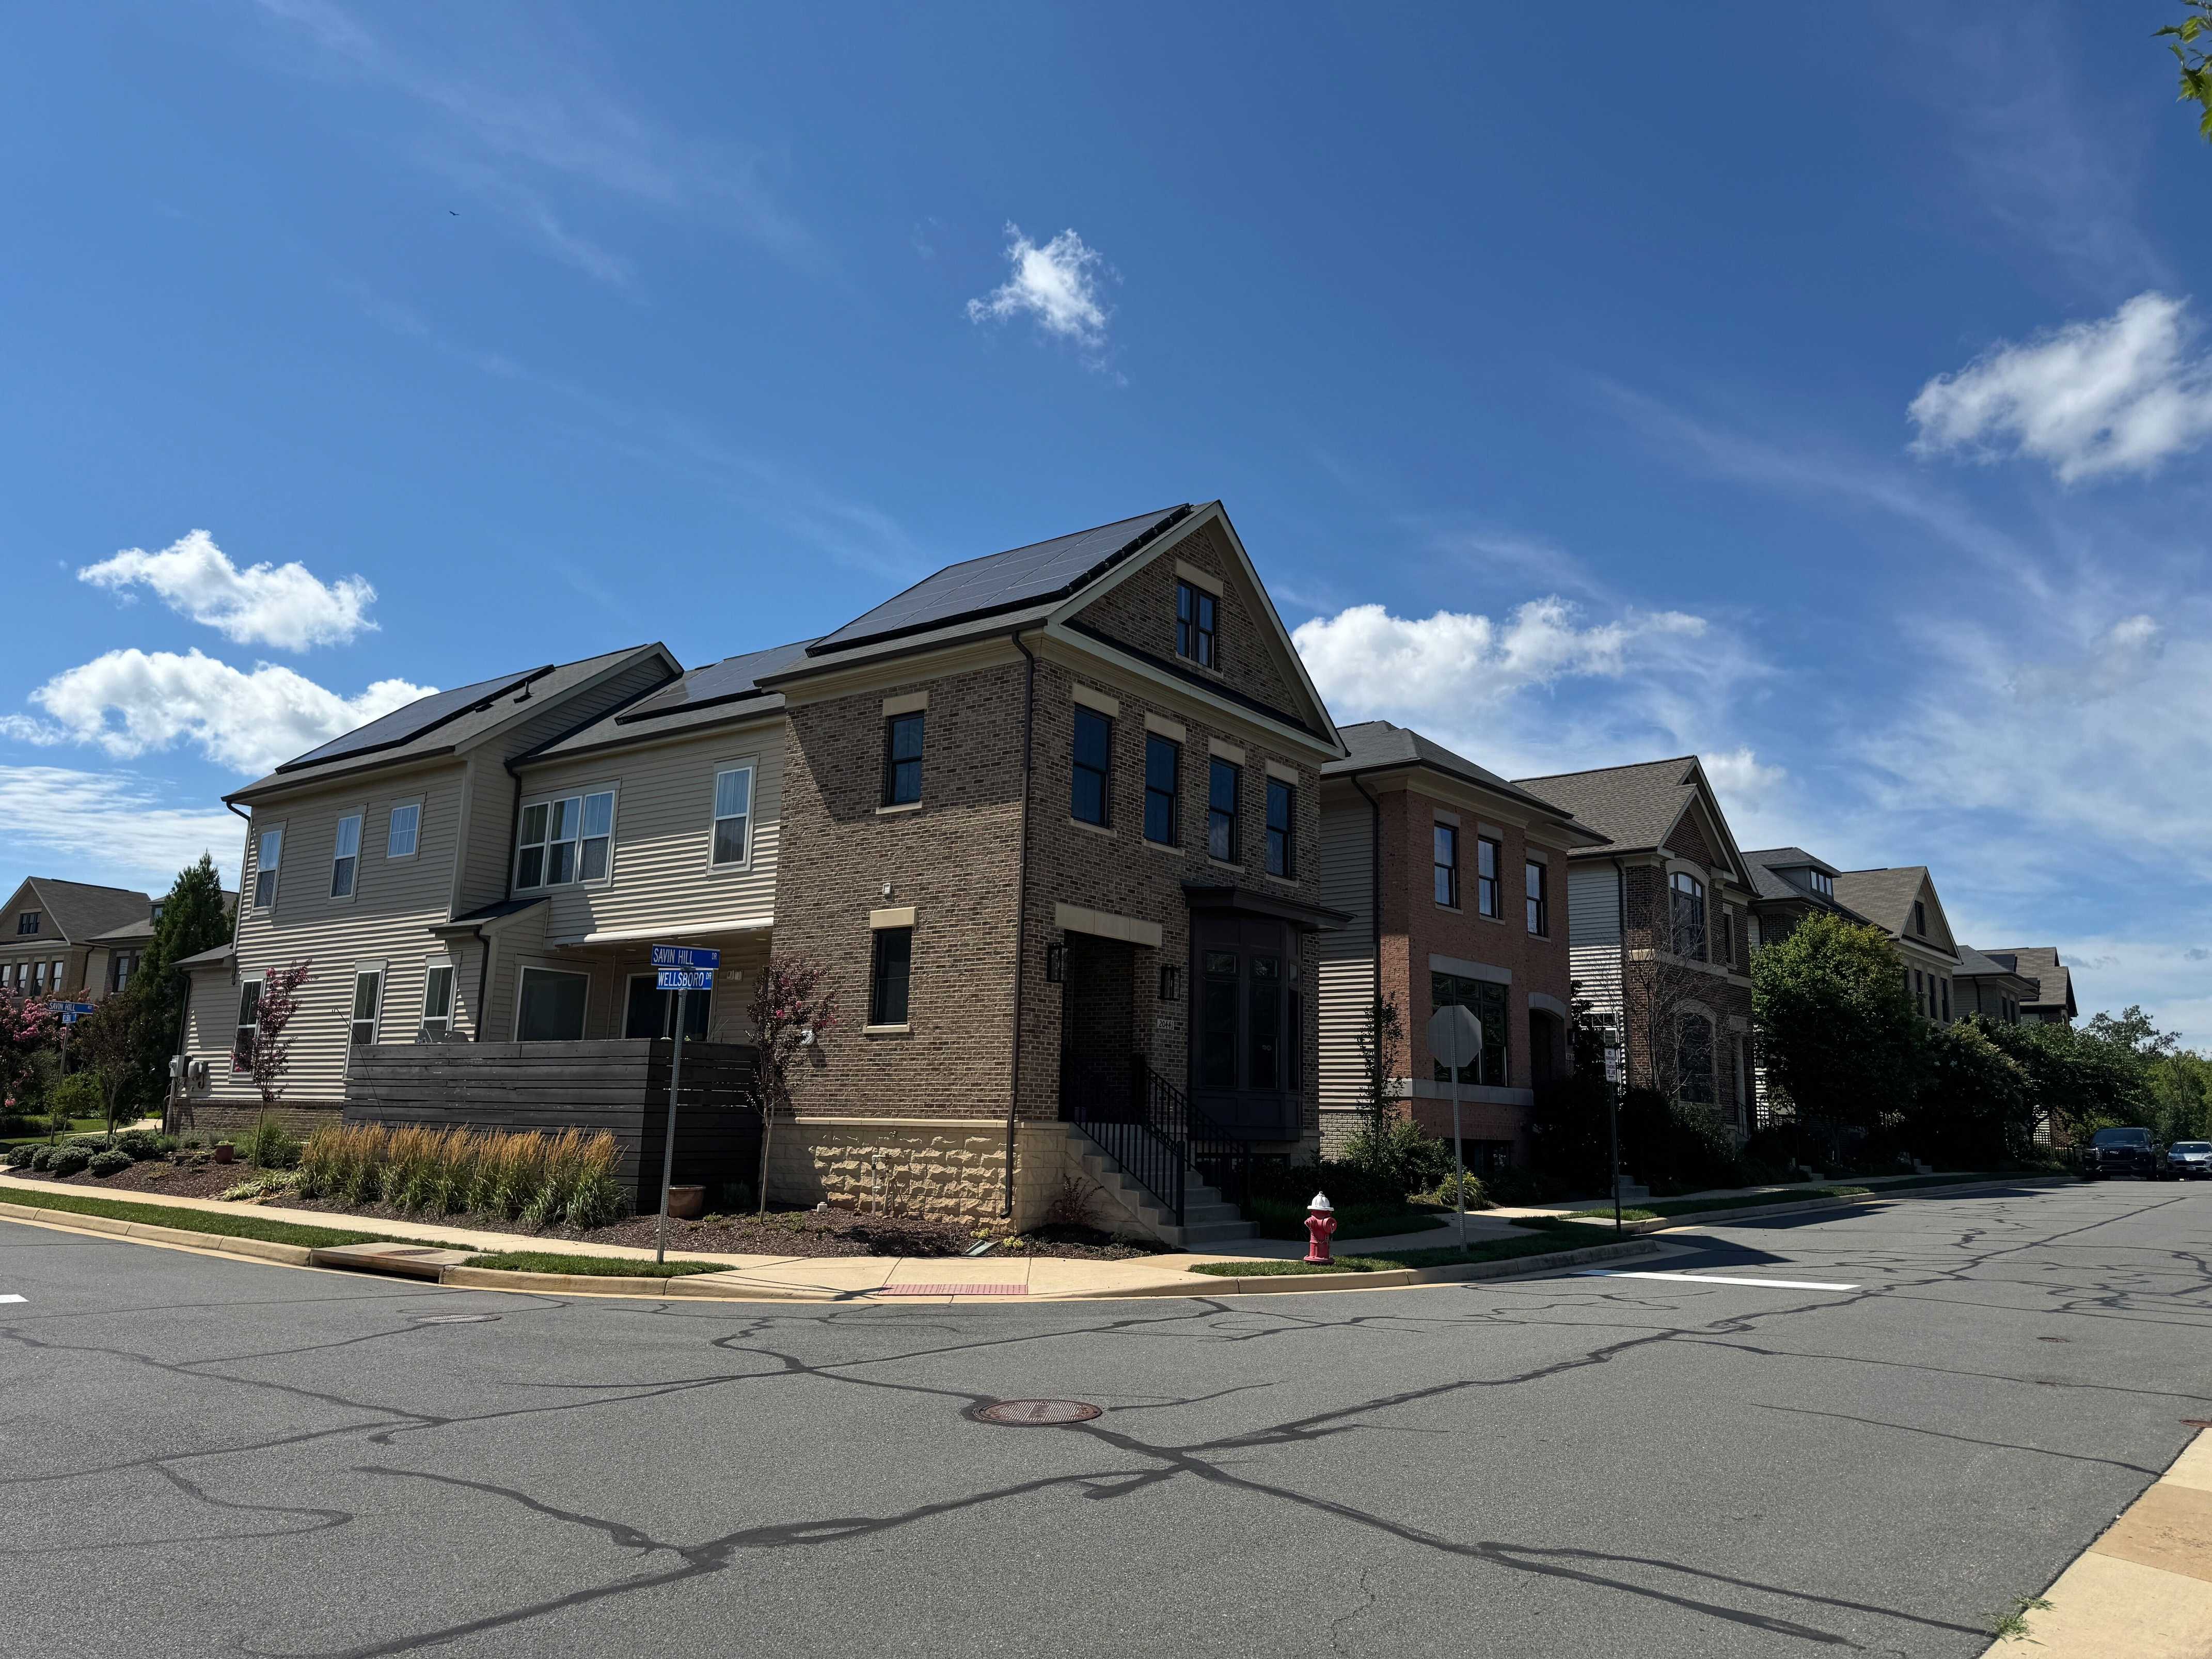
Loudoun’s $758,500 September median was up 0.8%, while new pendings declined 26.0% to 336. Closed sales totaled 338, down 17.8% from September 2025. The report showed 1,031 active listings and 31 average days on market.
For sellers, the weaker contract flow is worth watching alongside prices. For buyers, a countywide slowdown is a reason to examine available choices; it does not establish that every Ashburn townhouse or Leesburg detached home offers the same negotiating room. Watch Loudoun from 13:22.
Frederick County, Virginia: lower prices and a longer search for a buyer
Frederick County’s median was $420,000, down 6.7%, with 126 closings. New pendings were down 6.8% to 123. The report showed 453 active listings and 42 average days on market. Its YTD median also declined, to $430,000, down 4.1%.
Chris raises commuting and household costs as possible considerations for buyers looking farther out. That is his interpretation; the sales report does not identify the cause of each household’s decision. These figures cover Frederick County in Virginia, not Frederick County in Maryland or the independent City of Winchester. Watch from 15:25.
Stafford County: the important exception in new contracts
Stafford’s September median was $515,000, down 0.8%, across 135 closings. Unlike the other eight markets in this comparison, new pendings increased: 151 contracts, up 6.3%. New listings also increased, to 217, up 24.7%.
That is a useful check on sweeping regional claims. More homes coming to market can coexist with more contracts, even while the number of completed sales is lower. Stafford’s September closings were down 8.2%; that is a different measure from its increase in new pendings. Watch Stafford at 16:14.
Culpeper County: a small monthly sample, a pronounced slowdown
Culpeper had 44 September closings and a median of $475,500, down 4.1%. New pendings fell 31.6% to 39, while closed sales fell 31.3%. Those are substantial percentage changes, but the underlying counts matter: this is a smaller market than Fairfax or Loudoun.
The report showed 266 active listings and 38 average days on market. Its average sold-to-original-list-price ratio was 95.6%. That last measure compares sale prices with original list prices; it is not a promise that a buyer can take 4.4% off a home’s current asking price. Watch Culpeper from 16:39.
The longer view: January through September
The YTD figures help keep one month in perspective. Several markets with a lower September median still had a higher median across the first nine months. These are the reports’ January–September totals and medians, not sums or averages of monthly median prices.
| Market | Jan.–Sept. closed sales | Jan.–Sept. median | Price vs. Jan.–Sept. 2025 |
|---|---|---|---|
| Fairfax County | 9,374 | $770,000 | +1.9% |
| Alexandria City | 1,522 | $720,000 | 0.0% |
| Arlington County | 1,782 | $800,000 | +6.8% |
| Prince William County | 4,081 | $599,000 | +3.3% |
| Fauquier County | 769 | $660,000 | +2.3% |
| Loudoun County | 3,850 | $780,000 | +0.6% |
| Frederick County, VA | 1,123 | $430,000 | −4.1% |
| Stafford County | 1,584 | $550,000 | 0.0% |
| Culpeper County | 474 | $501,000 | +0.2% |
Same SmartCharts / Bright MLS reports shown in the October 22 livestream; all property types. YTD comparisons use January–September 2026 versus January–September 2025. Stafford’s reported 0.0% reflects rounding: $550,000 versus $549,900.
Inventory and time on market add another layer
These selected inventory and marketing-time figures were visible in the reports Chris reviewed. Inventory is the active-listing count at the end of September; average days on market is a separate sales statistic. Neither tells you exactly how long an individual home will take to sell.
| Market | September-end active listings | September average days on market |
|---|---|---|
| Fairfax County | 2,326 | 26 days |
| Arlington County | 582 | 33 days |
| Loudoun County | 1,031 | 31 days |
| Frederick County, VA | 453 | 42 days |
| Culpeper County | 266 | 38 days |
A buyer shopping in a segment with several close substitutes may have room to compare, ask questions and negotiate. A well-positioned home with few alternatives may still move quickly. The practical next step is to inspect the competition at the same price, property type and location.

Chris’s take: prepare for a slower negotiation
In the closing portion of the livestream, Chris describes buyers taking longer to commit and sellers needing more patience. He expects the difficult stretch to continue for a while. That is an outlook based on his work and the reports he reviewed—not a forecast that every home will lose value or a promise about when rates will change.
His seller advice is to pay attention to what the listing is actually producing. Around 18:10, he flags a home receiving fewer than one or two showings a week as a reason to look closely. That is his working benchmark, not a universal rule for every price range or location. At 18:23, he puts the next step plainly: “You need some really good feedback.”
For sellers, that means reviewing showing activity, competing listings, condition and price together. Agree on what would trigger an adjustment. A longer marketing period should prompt a conversation about evidence, not an automatic assumption that waiting will fix the problem.
For buyers, Chris discusses asking about inspection and appraisal terms, seller assistance and builder incentives. Those possibilities depend on the property and the offer. Compare the full cost and conditions of an incentive, including any required lender or title provider, instead of judging it by the advertised rate alone. Plan around a payment you can carry now; a future refinance is not guaranteed.
For context on the earlier phase of this discussion, read Chris’s previous market-shift report, which covered a different video and August figures. This report advances the picture with September’s local comparisons.
What does this mean for your home?
Selling in Northern Virginia? We can compare your home with the listings buyers are considering today. Buying? We can build a shortlist around your budget and evaluate the price, condition and terms of each option.
Talk through your local market with Chris →Watch the full October 22 market livestream
Open the full livestream on YouTube. The opening covers the broader market; the local report review runs roughly 3:22–17:11, followed by buyer and seller discussion. Statistics here are the September reports Chris presented, while observations and outlook retain their October 22 context.
Five questions about this market report
1. Is the Northern Virginia housing market crashing?
The September reports shown in this livestream do not establish a uniform regional crash. New contracts declined in eight of the nine markets covered, but median sold prices rose in Fairfax, Fauquier and Loudoun. Chris’s concern is a prolonged, uneven slowdown. That is his outlook, not a proven timetable for future prices.
2. Which market had the highest September median sold price?
Among these nine all-property-type reports, Loudoun County had the highest September median at $758,500, followed by Fairfax County at $749,750. Those figures describe the mix of homes that closed. They are not a ranking of the price of an identical home in each jurisdiction, and they do not include every Northern Virginia locality.
3. Why is September’s median different from the year-to-date median?
September includes only homes sold during that month. The year-to-date figure covers January through September and a larger, different sample. Arlington illustrates the distinction: September’s median was $655,000, down 4.6% year over year, while its January–September median was $800,000, up 6.8%. The YTD median is not an average of the nine monthly medians.
4. Do fewer new contracts mean the same number of failed sales?
No. New pendings measure homes going under contract during the period. Closed sales measure completed transactions, often following contracts signed earlier. A decrease in new pendings signals a smaller flow of new contracts; it does not mean that those missing contracts were signed and then canceled.
5. How should I use this report to price a home or make an offer?
Start with the table for the correct jurisdiction, then narrow the analysis to comparable homes of the same property type, location, size and condition. Review recent closed sales alongside current competing listings, pending activity and actual showing feedback. County medians, average marketing times and sale-to-original-list-price ratios are context, not a formula for a specific asking price or guaranteed discount.
Follow what changes next.
Get the local stories and housing conversations shaping Northern Virginia.
Subscribe to Real NoVA Network →Reporting notes: prepared October 23, 2026 from the full public livestream and its on-screen SmartCharts / Bright MLS reports. Source platform: SmartCharts. Numbers retain the period and geography shown in the video; they are not October month-to-date totals or a separate refreshed data pull. Report calculation timestamps were not consistently legible in the replay. Photos are authorized Colgan Team library images; capture dates are unverified. Chris’s observations are distinguished from the reported figures.
Enjoy this blog post? Click here to subscribe for updates
Leave A Comment